Overview
This project performs an exploratory data analysis of over 60,000 films sourced from The Movie Database (TMDB), uncovering patterns in genre popularity, audience ratings, and release trends across four decades of cinema (1980–2023).
Raw data is loaded into a local SQLite database, queried with SQL, then pulled into R for wrangling and visualization using the tidyverse ecosystem.
Key Findings
Popularity vs. Rating (Pearson Correlation, r = 0.087) There is a statistically significant but practically negligible relationship between popularity and audience rating. A movie can be widely watched without being highly rated — and vice versa.
Action vs. Drama Ratings (Welch T-Test, p < 0.001) Drama movies rate statistically higher than Action movies (6.27 vs. 5.96 average rating) across 35,000+ films — a small but highly significant gap suggesting audiences consistently reward narrative-driven films.
Visualizations
| Plot | Description |
|---|---|
| Releases per year | Number of movie releases per year (1980–2023) |
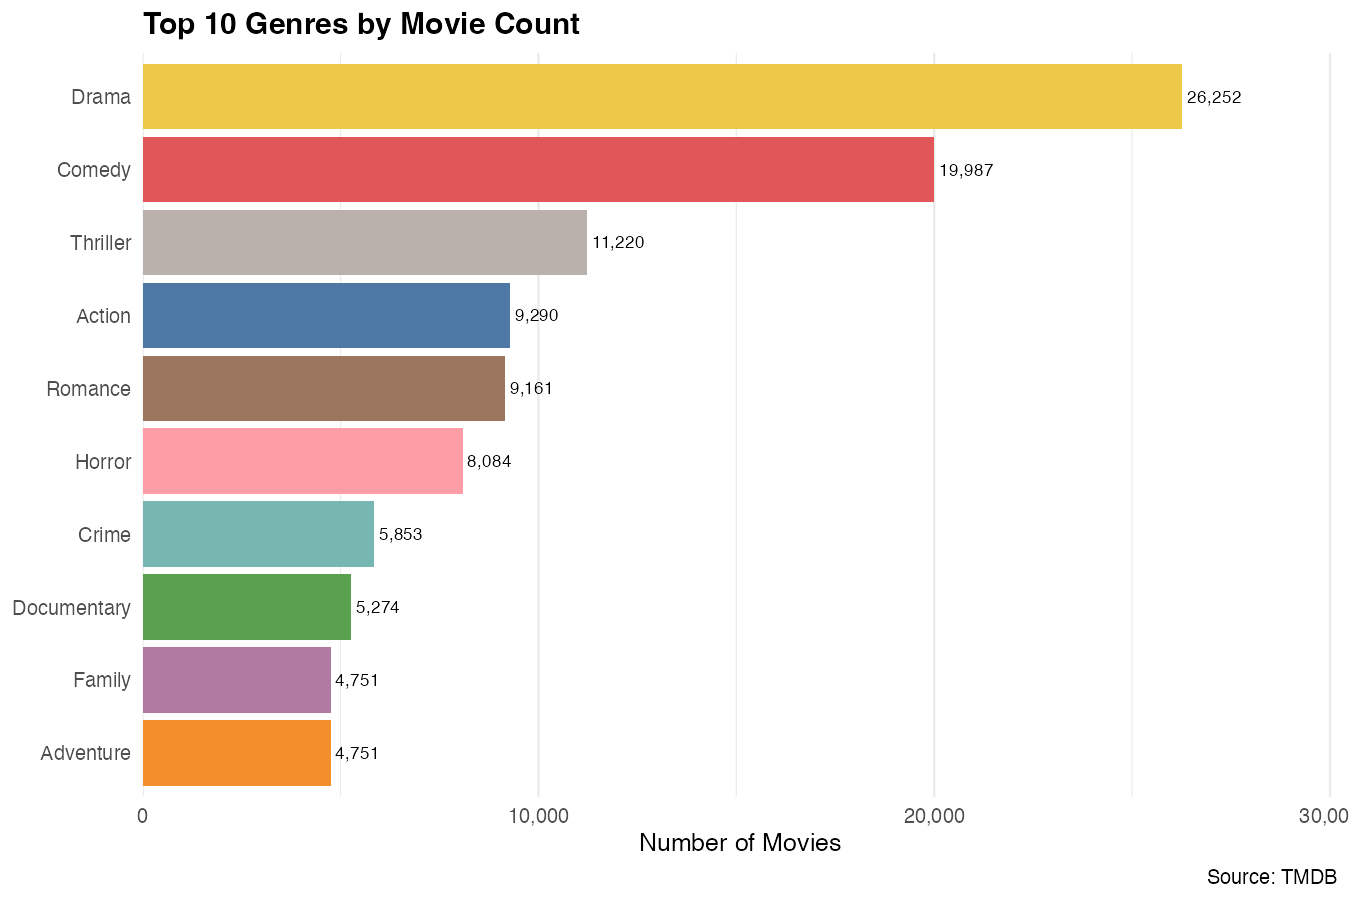
| Top genres | Top 10 genres by total movie count |
| Rating by genre | Top 10 genres by average audience rating |
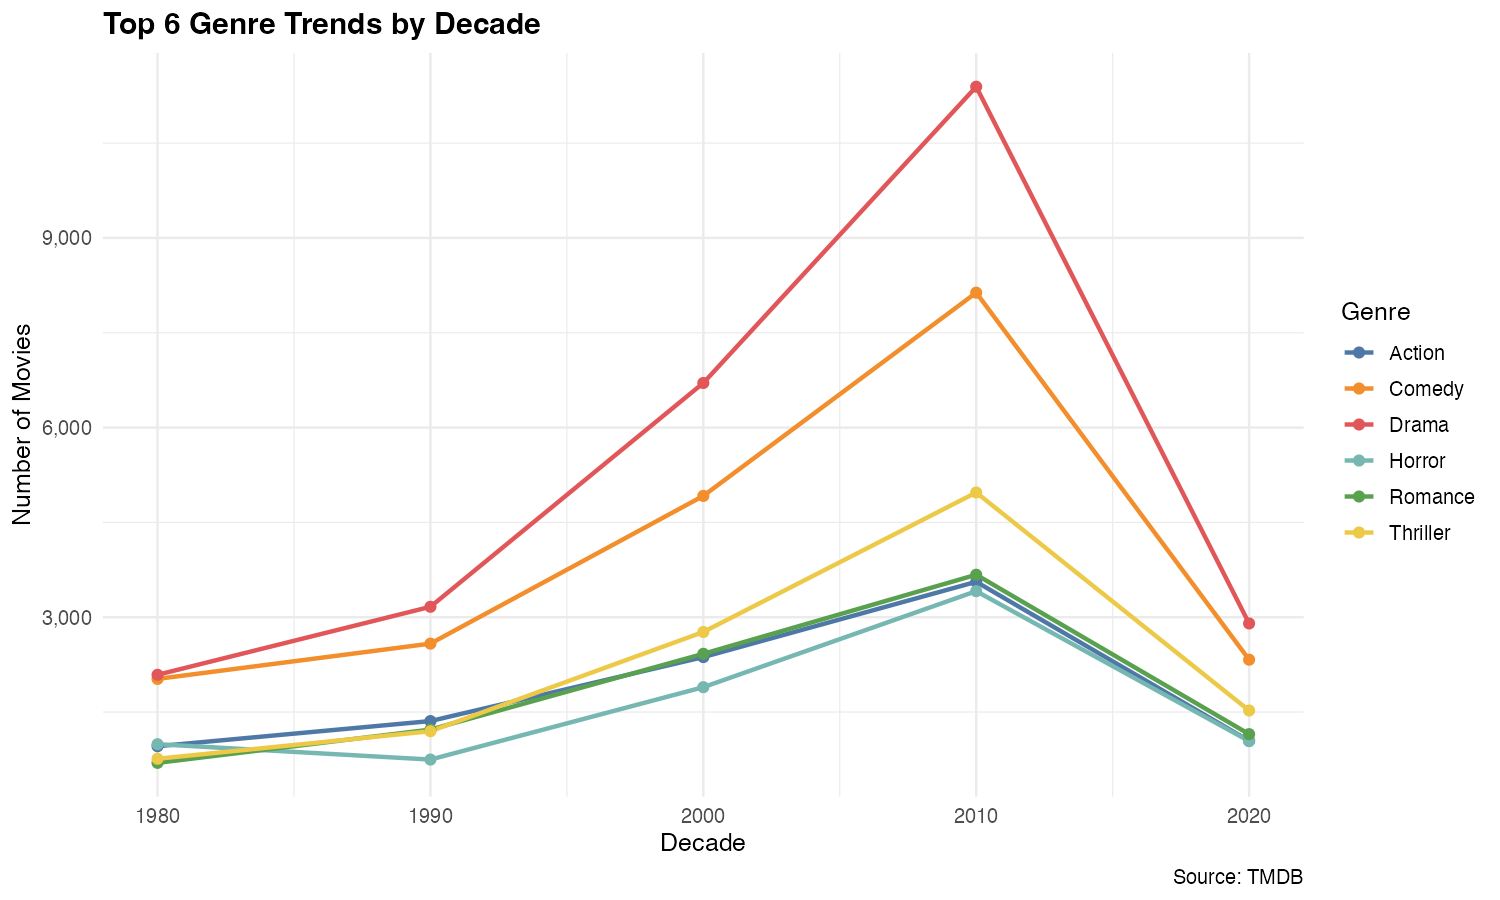
| Genre trends by decade | How the top 6 genres have grown or declined over time |
| Rating by decade | Average audience rating per decade |
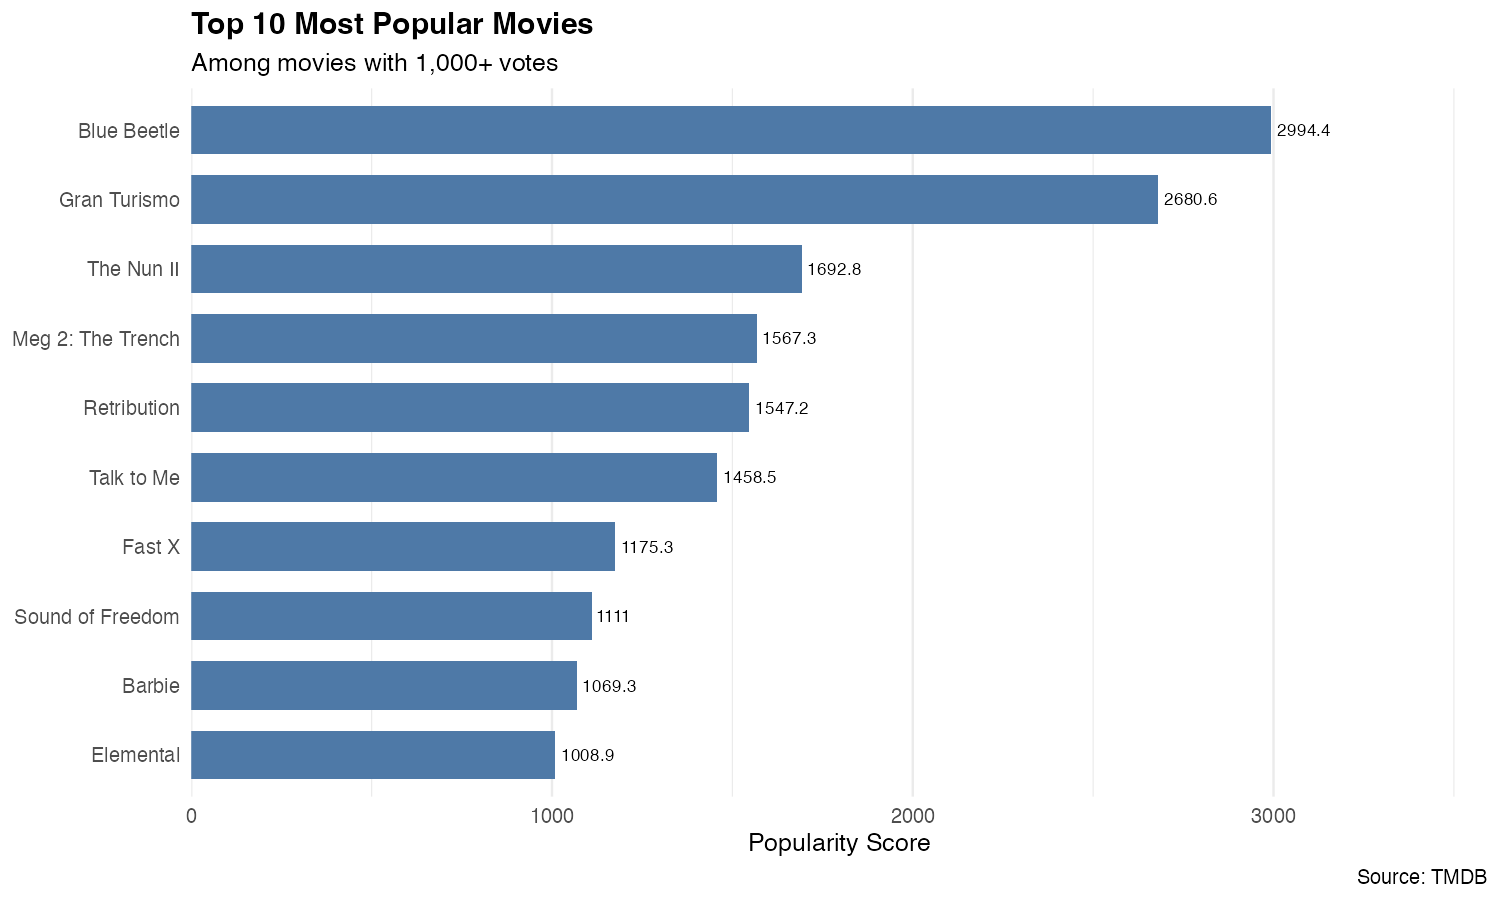
| Most popular | Top 10 most popular movies by TMDB popularity score |
Workflow
CSV → SQLite Database → SQL Query → R (tidyverse) → ggplot2 Visualizations
Data & Filtering Decisions
- Source: TMDB Movies Dataset — 1.38M rows, 24 columns
- Filters: Released status only, 1980–2023, minimum 10 votes per film
- Financial data excluded: Only ~17,000 of 1.38M entries had both budget and revenue recorded — insufficient for meaningful analysis
- Date handling: SQLite stores R date objects as integers; date filtering was handled in R via lubridate rather than directly in SQL
Statistical Analysis
- Pearson Correlation — tests whether popularity score is related to audience rating
- Welch Two-Sample T-Test — tests whether Action and Drama movies receive statistically different ratings (H₀: no significant difference)
Tech Stack
R tidyverse ggplot2 lubridate ggrepel scales SQLite DBI RSQLite Pearson Correlation Welch T-Test